Skip to content
Let’s talk
Menu

DATAMINT · ANALYTICS FOR SOLIDSERVER

See everything your DNS, DHCP and firewall infrastructure is telling you.

DataMint is an analytics appliance for SOLIDserver. It turns your DNS, DHCP and security logs into live dashboards and scheduled reports, all on one self-hosted VM.

DataMintDNS METRICS
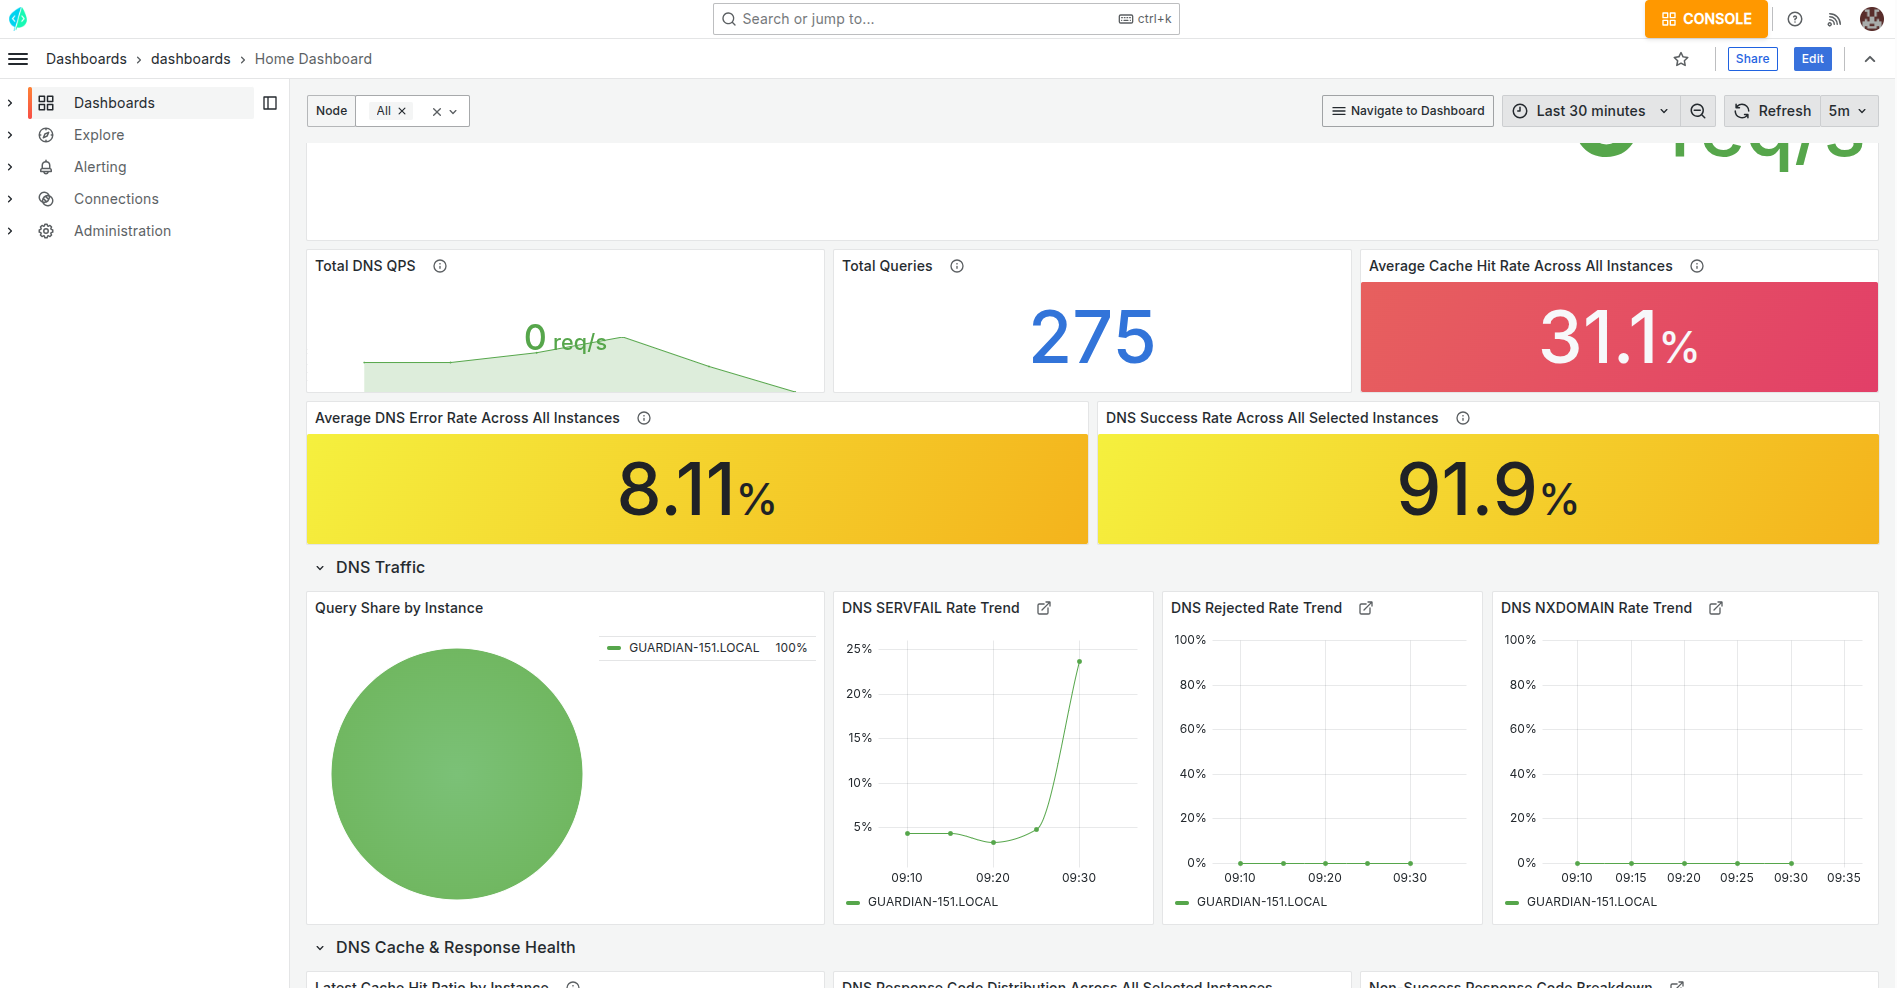
DataMint dashboard showing DNS query volume, cache hit rate, DNS error and success rates, and traffic trends.
The DNS metrics dashboard: query volume, cache hit rate and traffic trends.Enlarge screenshot (opens in a new tab)
From logs to insight
  • Self-hosted
  • Dashboards on day one
  • Works offline

THE PROBLEM

Your logs know. Your team can’t ask them.

DNS, DHCP and firewall data is spread across many nodes.
DataMint brings it into one place you can search.

Today: logs on every node

  • DNS, DHCP and DNS-firewall logs sit on many separate nodes.
  • “Who is querying what?” takes hours of searching.
  • “Is DNS slow?” and “What did the firewall block?” have no quick answer.
  • Building your own logging and dashboard stack takes time, and constant upkeep.

With DataMint: one place to look

  • Every node sends its logs to DataMint automatically.
  • Queries, clients, performance and blocks, on ready-made dashboards.
  • Months of history, still fast to query.
  • One appliance to run, with no stack to build.

HOW IT WORKS

Deploy. Connect. Explore.

No manual imports. Dashboards fill up as data arrives.

  1. 01

    Deploy

    Run the DataMint VM in your own environment.

  2. 02

    Connect

    Point your SOLIDserver nodes at DataMint. They start sending their logs on their own.

  3. 03

    Explore

    Open the dashboards, then schedule the reports your team needs.

SOLIDserver nodesDNS, DHCP, security
DataMintParse & store
DashboardsReports · email · SFTP
Nodes upload log bundles over a secure, token-based API. Processing starts as soon as data arrives.

THE SOLUTION

One appliance, end to end.

Collect

  • Nodes upload log bundles on their own.
  • DNS queries, DHCP, firewall, DNS firewall (RPZ), Guardian, audit and host info.
  • Stored as time-series metrics, fast over long ranges.
  • Retention tools keep disk use under control.

See

  • 15+ dashboards ready out of the box.
  • 150+ reusable panels.
  • DNS, DHCP, security and system health in one view.

Report

  • Turn any dashboard into a PDF report.
  • Schedule reports on your timetable.
  • Deliver them by email or SFTP.

Run

  • One web console for users, instances, dashboards, reports, jobs, storage and updates.
  • Role-based access with LDAP login.
  • Your logo and name in the console and dashboards.

READY ON DAY ONE

Dashboards, out of the box.

More than 15 dashboards and 150 panels are ready the moment your first data arrives. There’s nothing to build.

Dashboards
15+
Panels
150+
  • DNS

    DNS metrics, performance (daily and over time) and QPS monitoring.

  • Clients

    Client DNS analytics and daily trends.

  • DHCP

    DHCP analytics.

  • Security

    DNS firewall, Guardian security and Guardian list logs.

  • Health

    System, database and appliance health, plus BSD and system logs.

WHO IT’S FOR

One appliance. Three teams covered.

Network and DNS operations

See query volume, latency and QPS across every node, and catch a slow DNS before users do.

Security teams

Watch DNS-layer threats: what the DNS firewall blocked, Guardian events, and which clients asked for what.

IT managers

Get regular reports on service health and usage, delivered on schedule with no one exporting by hand.

BUILT TO RUN ITSELF

Your network. Your data. Low upkeep.

  • Self-hosted. Your data never leaves your network.
  • Safe updates. One-click updates from signed packages, with a backup first and rollback if needed.
  • Air-gap ready. Updates bundle their own dependencies, so no internet access is needed.
  • Self-healing. Built-in health monitoring keeps services running.
  • Secure by default. TLS throughout, and services don’t run as root.

FAQ

Questions we hear often.

Something else on your mind? Our team is happy to walk through your setup.

Ask a question
Where does our data live?

On the DataMint VM, inside your own network. Nothing is sent to an outside service.

Which data does DataMint collect?

DNS query logs, DHCP, firewall logs, DNS firewall (RPZ), Guardian security, system audit and host information from your SOLIDserver nodes.

Do we have to import logs by hand?

No. Nodes upload their log bundles on their own over a secure, token-based API, and processing starts as soon as data arrives.

Does it work without internet access?

Yes. DataMint runs in air-gapped networks, and updates bundle their own dependencies.

How are updates handled?

Updates come as signed packages you apply in one click from the console. DataMint takes a backup before every update, and you can roll back.

Can we use our existing directory login?

Yes. DataMint supports LDAP login with role-based access, and signs users into the dashboards with single sign-on.

Can reports be sent automatically?

Yes. Turn any dashboard into a PDF report, schedule it, and deliver it by email or SFTP.

SEE IT ON YOUR DATA

From logs to insight, on day one.

Tell us about your SOLIDserver nodes and reporting needs. We’ll show you DataMint running on data like yours.

Request a demo